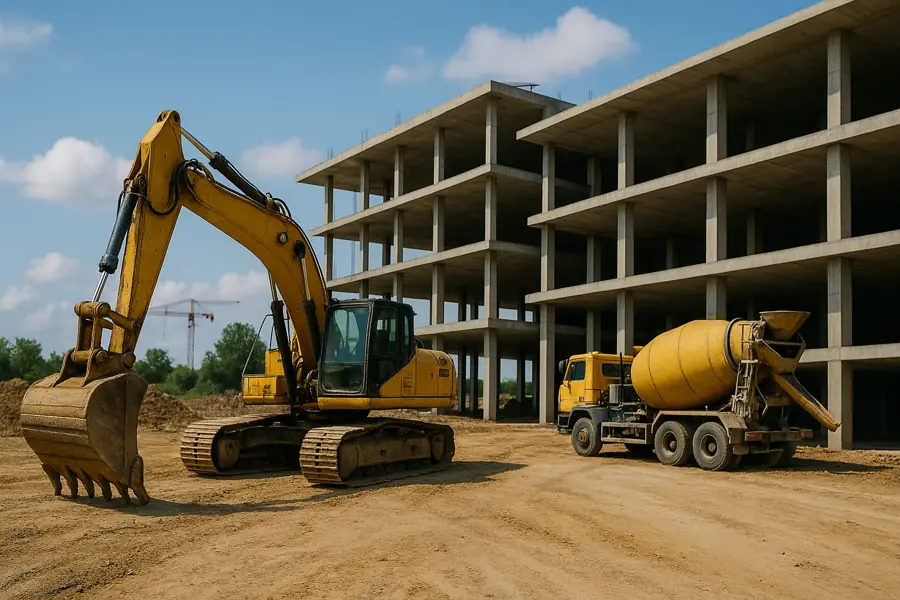
What Physical Progress Really Reveals About Your Construction Projects
Introduction
In construction project management, physical progress is a key performance indicator used to monitor and assess the actual progress of works on site.
When managing a project, stakeholders want to know: Where do we stand? Where are we going? Are we on the right track?
The only way to answer these questions objectively is to measure physical progress. But what does it really mean? And how is it measured?
I. Definition of Physical Progress
Physical progress is the ratio between two physical quantities, expressed as a percentage. It provides the most reliable and measurable indication of how far a task or a group of tasks has advanced. By aggregating these values, one can assess the progress of an entire project.
It’s important not to confuse physical progress with schedule progress or cost progress:
-
Schedule progress measures the time elapsed compared to the planned schedule. For example, if a task is planned for six weeks and three weeks have passed, schedule progress is 50%.
-
However, this doesn’t tell us what portion of the physical work has been completed. Physical progress focuses on what has actually been produced.
In short, physical progress offers the most accurate view of where a construction project truly stands.
II. Methods for Calculating Physical Progress
Several methods exist to evaluate physical progress:
-
Equivalent Unit Method
This method is based on standard measurable units. For example, if 5 meters of cable have been installed out of a total of 10 meters, the physical progress is 50%. -
Milestone Method
The task is divided into milestones or checkpoints, each assigned a predefined percentage. Progress increases as milestones are reached. -
Expert Judgment Method
An experienced project manager or engineer estimates the percentage completed. This is a quick and straightforward approach, though more subjective. -
0-100 / 50-100 Methods
For short-duration tasks:-
The 0-100 method records 0% until the task is complete, then jumps to 100%.
-
The 50-100 method records 50% when started, and 100% upon completion.
-
-
Weighted Items Technique
This approach is used for groups of tasks. Each task is assigned a weight based on its importance in the overall project. Weights can be based on:-
The financial value of each task relative to the total.
-
The execution complexity or level of effort required.
-
This technique is often combined with the methods above to calculate overall progress more precisely.
III. Case Study: Using PROTRACKBTP to Track Progress
The PROTRACKBTP application streamlines the monitoring of physical progress—even on large and complex projects. By combining the weighted items method with the equivalent unit method, PROTRACKBTP allows users to model any construction project with detailed task structures and assigned coefficients.
Practical Example: A Construction Site
Let’s take the example from a previous article, where a contractor is awarded a project including both building works (all trades) and roadwork/utility works.
-
Building works: 91,838,990 CFA
-
Roadworks: 103,211,000 CFA
-
Total before tax: 195,049,990 CFA
-
VAT (18%): 35,108,998 CFA
-
Total including tax: 230,158,988 CFA
The company uses PROTRACKBTP to track the physical progress of the project.
Step 1: Setting up the elements to monitor
Each main component is assigned a progress coefficient:
-
Building: Coefficient 0.47 — Planned from April 1st to November 30th, 2024
-
Roadworks: Coefficient 0.53 — Planned from August 1st to November 30th, 2024
Setting the elements to be monitored with their coefficients
Step 2: Defining sub-elements and assigning weights
Each element is broken down into sub-elements, each with its own coefficient:
For the Building:
-
Foundations: 0.15
-
Structural Works: 0.35
-
Finishes and Secondary Works: 0.5
Definition of the sub-elements constituting the building construction task
For the Roadworks:
-
Earthworks: 1
-
Pavement: 1
Definition of the sub-elements constituting the road construction task
Each sub-element can itself be divided into further subcomponents, making it possible to model projects of any size or complexity.
Progress Tracking in Action
Once the setup is complete, the project manager only needs to record quantities completed for each sub-element at specific dates.
List of items to follow Building and roads
List of sub-elements to track in Building
Various progress reports made for the foundations
The system will automatically calculate the overall physical progress.
Overall physical progress of the project
Visual Reporting
The dashboard offers a graphical comparison:
-
Red curve: Actual physical progress (e.g., 94.7%)
-
Green curve: Planned progress (e.g., 47.99%)
This makes it easy to spot delays or ahead-of-schedule performance at a glance.
Users can also zoom in on a specific element—like Roadworks—to analyze its performance.
Details of the progress of the roadworks element
Detailed Progress Table
A detailed progress calculation table is available to audit how progress percentages were derived.
Detailed calculation table of overall progress
"Time Travel" Feature
PROTRACKBTP also allows users to retrieve the physical progress at any past date—perfect for progress reports, audits, or stakeholder communication.
Example: Viewing the status as of July 31st, 2024.
Conclusion
Physical progress tracking is essential for:
-
✅ Monitoring execution: Identify lags and compare actual vs. planned progress
-
✅ Performance analysis: Adjust resources and improve team efficiency
-
✅ Stakeholder reporting: Provide reliable data to clients, partners, and funders
While tracking progress can become complex as a project scales, tools like PROTRACKBTP make it faster, more reliable, and easier to manage.
👉 Want to try it yourself? Click here to get started
What About You?
How do you measure the physical progress of your construction projects?
 PROTRACKBTP


